Captures
About the images: channels and composites
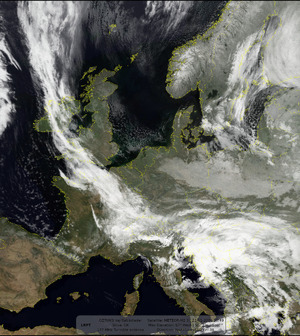
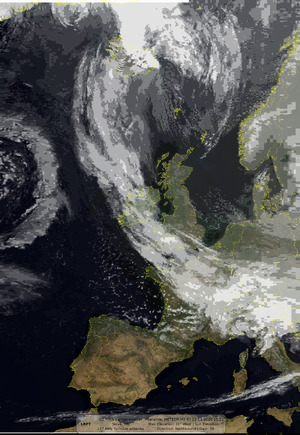
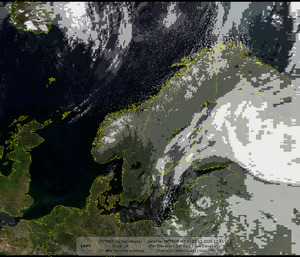
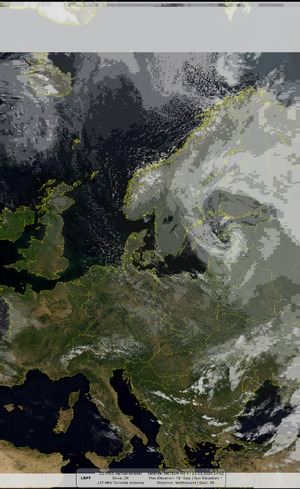
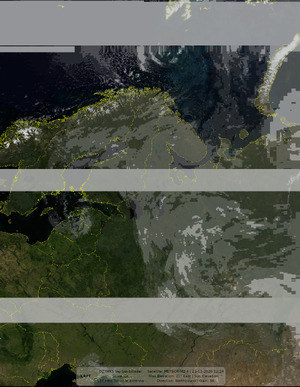
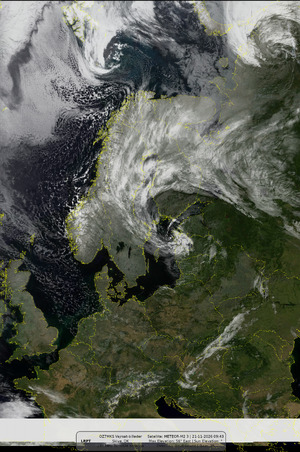
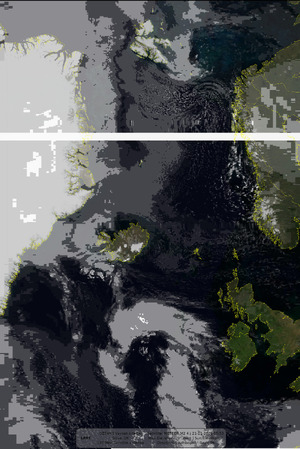
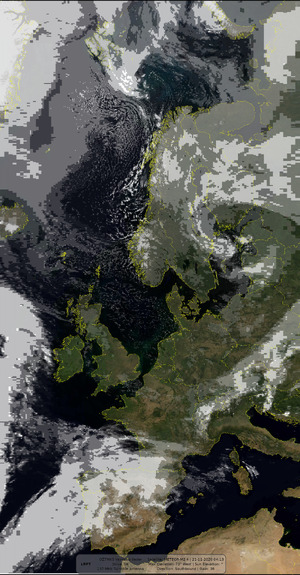
METEOR's MSU-MR scanner sees the Earth in six channels; LRPT sends three of them at a time (usually 1, 2 and 4). SatDump mixes the channels it receives into the images below; a pass only has the images its channels allow.
Channels
| # | Band | |
|---|---|---|
| 1 | 0.5–0.7 µm | Visible red light: clouds, land and sea by day |
| 2 | 0.7–1.1 µm | Near infrared: vegetation bright, water dark; by day |
| 3 | 1.6–1.8 µm | Shortwave infrared: snow and ice dark, water clouds bright; by day |
| 4 | 3.5–4.1 µm | Mid-wave infrared: clouds, fog and fires, day and night |
| 5 | 10.5–11.5 µm | Thermal infrared: temperature of cloud tops, land and sea, day and night |
| 6 | 11.5–12.5 µm | Thermal infrared: with channel 5, thin cirrus, dust and moisture |
Images
| Channels | ||
|---|---|---|
| MSU-MR Channel 1–6 | 1 … 6 | Each received channel on its own, in grey (geometry corrected) |
| MSA | 1 | Clouds from channel 1 laid over a colour map of the Earth: looks natural, by day |
| MCIR | 4 | Infrared clouds laid over a colour map of the Earth: the same look day and night |
| AVHRR 221 False Color | 2, 2, 1 | False colour: land yellow and brown, vegetation brighter, sea dark blue, clouds white |
| AVHRR 3a21 False Color | 3, 2, 1 | False colour: snow and ice cyan, clouds white, vegetation green |
| MSU-MR 124 / AVHRR 124 | 1, 2, 4 / 1, 2, 5 | False colour with infrared: cold, high clouds bluish |
| Natural Color | 1, 2, 3 | Close to what the eye would see |
| Day Microphysics | 1, 4, 5 | Cloud types by day: water clouds and ice clouds in different colours |
| Night Microphysics | 4, 5, 6 | Fog and low cloud at night |
| 10.8 µm Thermal IR | 5 | Thermal infrared in grey: the colder (higher) the cloud, the whiter |
| 3.9 µm Shortwave IR | 4 | Mid-wave infrared in grey: clouds and fog at night, hot spots such as fires stand out |
| 3.9 µm Cloud Tops | 4 | Only the cloud tops, the rest transparent |
| 3.75 µm IR (Rainbow, Enhanced Rainbow, CIRA) | 4 | Temperature in colours, from the 3.75 µm channel |
| Enhanced IR | 5 | Coldest, stormiest cloud tops highlighted in colour |
| Cloud Top IR | 5 | Cloud-top height from temperature, in colour |
| Color general cloud IR | 5 | Cloud temperatures on a colour scale |
| Color convection longwave IR | 5 | Deep convection (thunderstorms) highlighted |
| AVHRR 543b / 3b45 IR False Color | 4, 5, 6 | Infrared-only false colour: works day and night |
| Sea Surface Temperature | 5 | Sea surface temperature, land masked out |
| Split Window Difference | 5, 6 | Difference of the two thermal channels: thin cirrus, dust and moisture |
Other parts of a capture
- Corrected: the edges of the scan unstretched, so shapes are true
- Projected (map): turned into a flat map of the area
- Yellow lines: borders and coastlines; red names: capital cities; the panel: station and pass details
- Sky track: the pass seen from the station, overhead in the centre
- Elevation & azimuth: the satellite's height and direction during the pass
- Spectrogram: the received signal, its strength (SNR) and when the decoder locked
- SSTV: slow-scan TV pictures the ISS sends during ARISS events (437.550 MHz FM; Robot 36 on 437.550 MHz, PD120 on 145.800 MHz)
- APRS map: radio amateurs whose position packets the ISS relayed on 437.825 MHz while it passed over (between SSTV events)
M2 3
20:49
67°

M2 3
19:10
29°
M2 4
15:21
31°
M2 4
13:41
57°
M2 4
12:03
16°
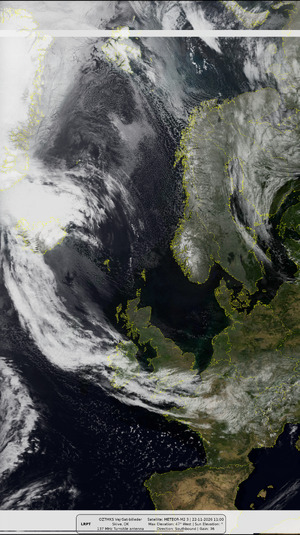
M2 3
11:00
47°
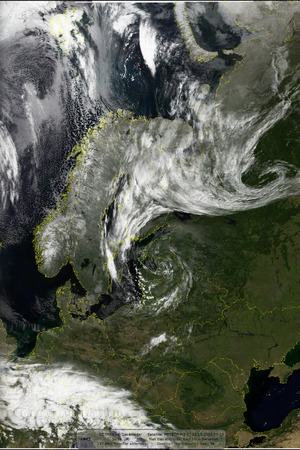
M2 3
09:20
39°
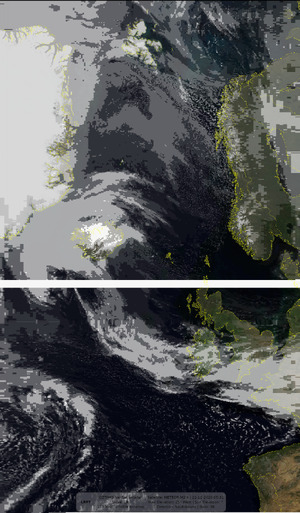
M2 4
05:31
25°
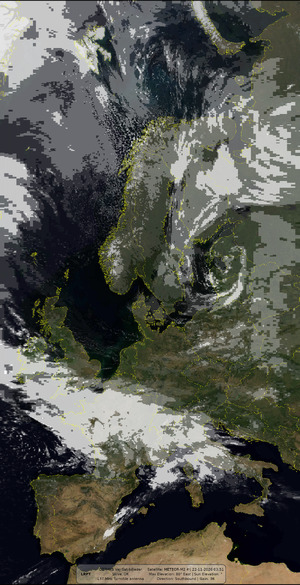 Best pass
M2 4
03:51
80°
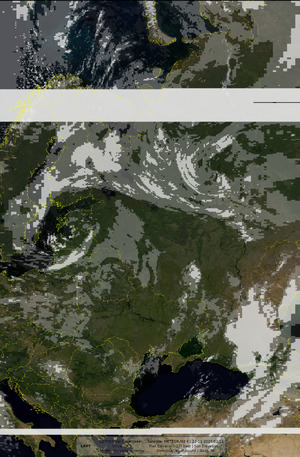
M2 4
02:11
17°
No passes match the filter on this day
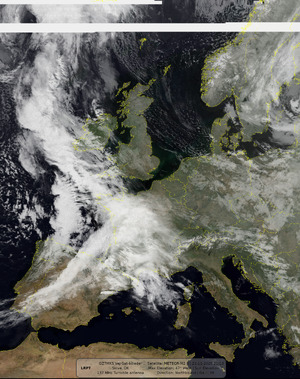
M2 3
21:13
47°
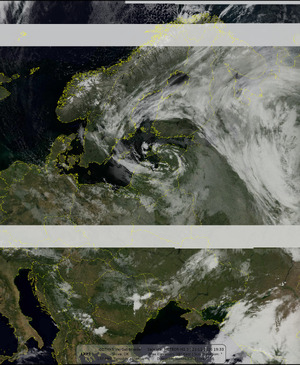
M2 3
19:33
39°
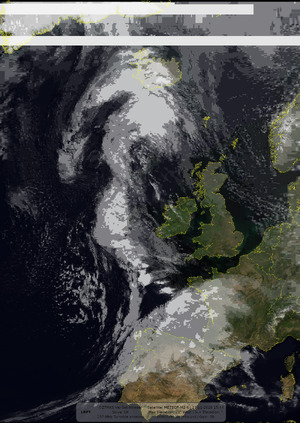
M2 4
15:44
23°
 Best pass
M2 4
14:02
78°
M2 4
12:24
21°
M2 3
09:43
56°
M2 4
05:53
20°
M2 4
04:13
73°
No passes match the filter on this day